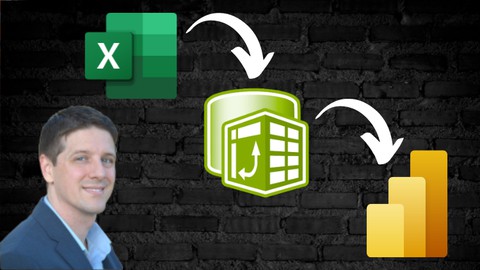
Power Bi And Power Query For Excel Users

Power Bi And Power Query For Excel Users
Published 3/2024
MP4 | Video: h264, 1920x1080 | Audio: AAC, 44.1 KHz
Language: English
| Size: 1.82 GB[/center]
| Duration: 3h 31m
Learn Power BI and Power Query Using Your Excel Skills. Real Life Project Approach
What you'll learn
Connect to external data sources
Cleanse and transform data
Model data
Create measures (KPIs)
Create reports
Requirements
Basic Microsoft Excel skills required, familiarity with pivot tables.
Description
For each project, there is an Excel version, a Power Query version, and a Power BI version. This reinforces learning, and you will see how Microsoft has ingeniously linked the platforms, and the role each one plays.Some Courses Advertise Hundreds of Hours of Content.I keep it straight to the point. I will not be listing all the Excel functions, I will not be explaining every Power BI menu ribbon item.instead, we will jump straight into real projects, and I will guide you step-by-step through the analytics process.We will approach each project the same way:Define the business problem;Review and classify raw data and source systems;Load, transform, cleanse, and organize data into a data model;Build the visualizations and reportsWe will do an Excel version, a Power Query version, and a Power BI version.Once you do a handful of projects, you will notice patterns to the process.This is where things begin to "click". And that's more powerful than any course that simply walks you through what each function does and then has one Case Study at the end.My goal is to help you see those patterns today and think and work like an analyst.Follow along as we complete Real World projects.
Overview
Section 1: 1.0 AR Report - Project Overview
Lecture 1 Problem Statement and Preview of Final Product
Lecture 2 Project Structure and Outline
Lecture 3 Setting Expectations
Section 2: 1.1 AR Report - Excel version
Lecture 4 Load AR Data (Fact Table)
Lecture 5 Load dClientCode (Dimension Table)
Lecture 6 Create the ClientName Lookup
Lecture 7 Create the 'Days Overdue' Calculated Column
Lecture 8 Create the 1st Pivot Table Report
Lecture 9 Create the 2nd Pivot Table Report
Lecture 10 Create the 3rd Pivot Table Report
Lecture 11 Create the 3rd Pivot Table Report, slicer
Lecture 12 Where Excel Would Fall Short
Section 3: 1.2 AR Report - Power Query version
Lecture 13 File Overview
Lecture 14 Load AR Data (Fact Table)
Lecture 15 Load dClientCode (Dimension Table)
Lecture 16 Create The Relationships
Lecture 17 Create the Custom Column
Lecture 18 Create the 1st Pivot Table Report
Lecture 19 Create the 2nd Pivot Table Report
Lecture 20 Create the 3rd Pivot Table Report
Section 4: 1.3 AR Report - Power BI version
Lecture 21 File Overview
Lecture 22 Load AR Data (Fact Table)
Lecture 23 Load dClientCode (Dimension Table)
Lecture 24 Create The Relationships
Lecture 25 Create the 'Days Overdue' Calculated Column
Lecture 26 Create the 1st Report
Lecture 27 Create the 2nd Report
Lecture 28 Create the 3rd Report
Section 5: 2.0 Labor Analysis - Project Overview
Lecture 29 Problem Statement and Preview of Final Product
Lecture 30 Project Structure and Outline
Lecture 31 Setting Expectations
Section 6: 2.1 Labor Analysis - Excel Version
Lecture 32 File Overview
Lecture 33 Load the Data
Lecture 34 Create the Calculated Columns 1
Lecture 35 Create the Calculated Columns 2
Lecture 36 Create the Pivot Tables
Lecture 37 Where Excel Would Fall Short
Section 7: 2.2 Labor Analysis - Power Query Version
Lecture 38 File Overview
Lecture 39 Load the Data
Lecture 40 Create The Relationships
Lecture 41 Create the DAX Measure
Lecture 42 Create the Pivot Tables
Section 8: 2.3 Labor Analysis - Power BI Version
Lecture 43 File Overview
Lecture 44 Load the Data
Lecture 45 Create The Relationships
Lecture 46 Create the DAX Measure
Lecture 47 Create the Report
Section 9: 3.0 HR Turnover - Project Overview
Lecture 48 Problem Statement and Preview of Final Product
Lecture 49 Project Structure and Outline
Lecture 50 Setting Expectations
Section 10: 3.1 HR Turnover - Excel Version
Lecture 51 File Overview
Lecture 52 Load the Data
Lecture 53 Create the Calculated Columns
Lecture 54 Create the Pivot Table Report
Lecture 55 Where Excel Would Fall Short
Section 11: 3.2 HR Turnover - Power Query Version
Lecture 56 File Overview
Lecture 57 Load the Data
Lecture 58 Create The Relationships
Lecture 59 Create the Calendar Table
Lecture 60 Create the DAX Measure
Lecture 61 Create the Pivot Table Report
Section 12: 3.3 HR Turnover - Power BI Version
Lecture 62 File Overview
Lecture 63 Load the Data
Lecture 64 Create The Relationships
Lecture 65 Create the DAX Measure
Lecture 66 Create the Report
Section 13: 4.0 Dealer Interactions - Project Overview
Lecture 67 Problem Statement and Preview of Final Product
Lecture 68 Project Structure and Outline
Lecture 69 Setting Expectations
Section 14: 4.1 Dealer Interactions - Excel Version
Lecture 70 File Overview
Lecture 71 Load the Data
Lecture 72 Create the Calculated Columns
Lecture 73 Create the Report
Lecture 74 Where Excel Would Fall Short
Section 15: 4.2 Dealer Interactions - Power Query Version
Lecture 75 File Overview
Lecture 76 Load the Data
Lecture 77 Create The Relationships
Lecture 78 Create the Calendar Table
Lecture 79 Create the DAX Measures
Lecture 80 Create the Report
Section 16: 4.3 Dealer Interactions - Power BI Version
Lecture 81 File Overview
Lecture 82 Load the Data
Lecture 83 Create The Relationships
Lecture 84 Create the DAX Measures
Lecture 85 Create the Report (table)
Lecture 86 Create the Report (chart)
Excel users looking to level up to Power Query and Power BI


Power BI and Power Query for Excel Users
