New Relic: Performance monitoring tool (from Zero to Hero)

New Relic: Performance monitoring tool (from Zero to Hero)
Published 4/2024
Duration: 3h35m | .MP4 1280x720, 30 fps(r) | AAC, 44100 Hz, 2ch | 1.57 GB
Genre: eLearning | Language: English [/center]
Analyze performance key metrics using APM services, Transactions, Trace, Dashboard and create Advanced Monitoring system
What you'll learn
Understand basic and advanced concepts of APM and New Relic tool usage.
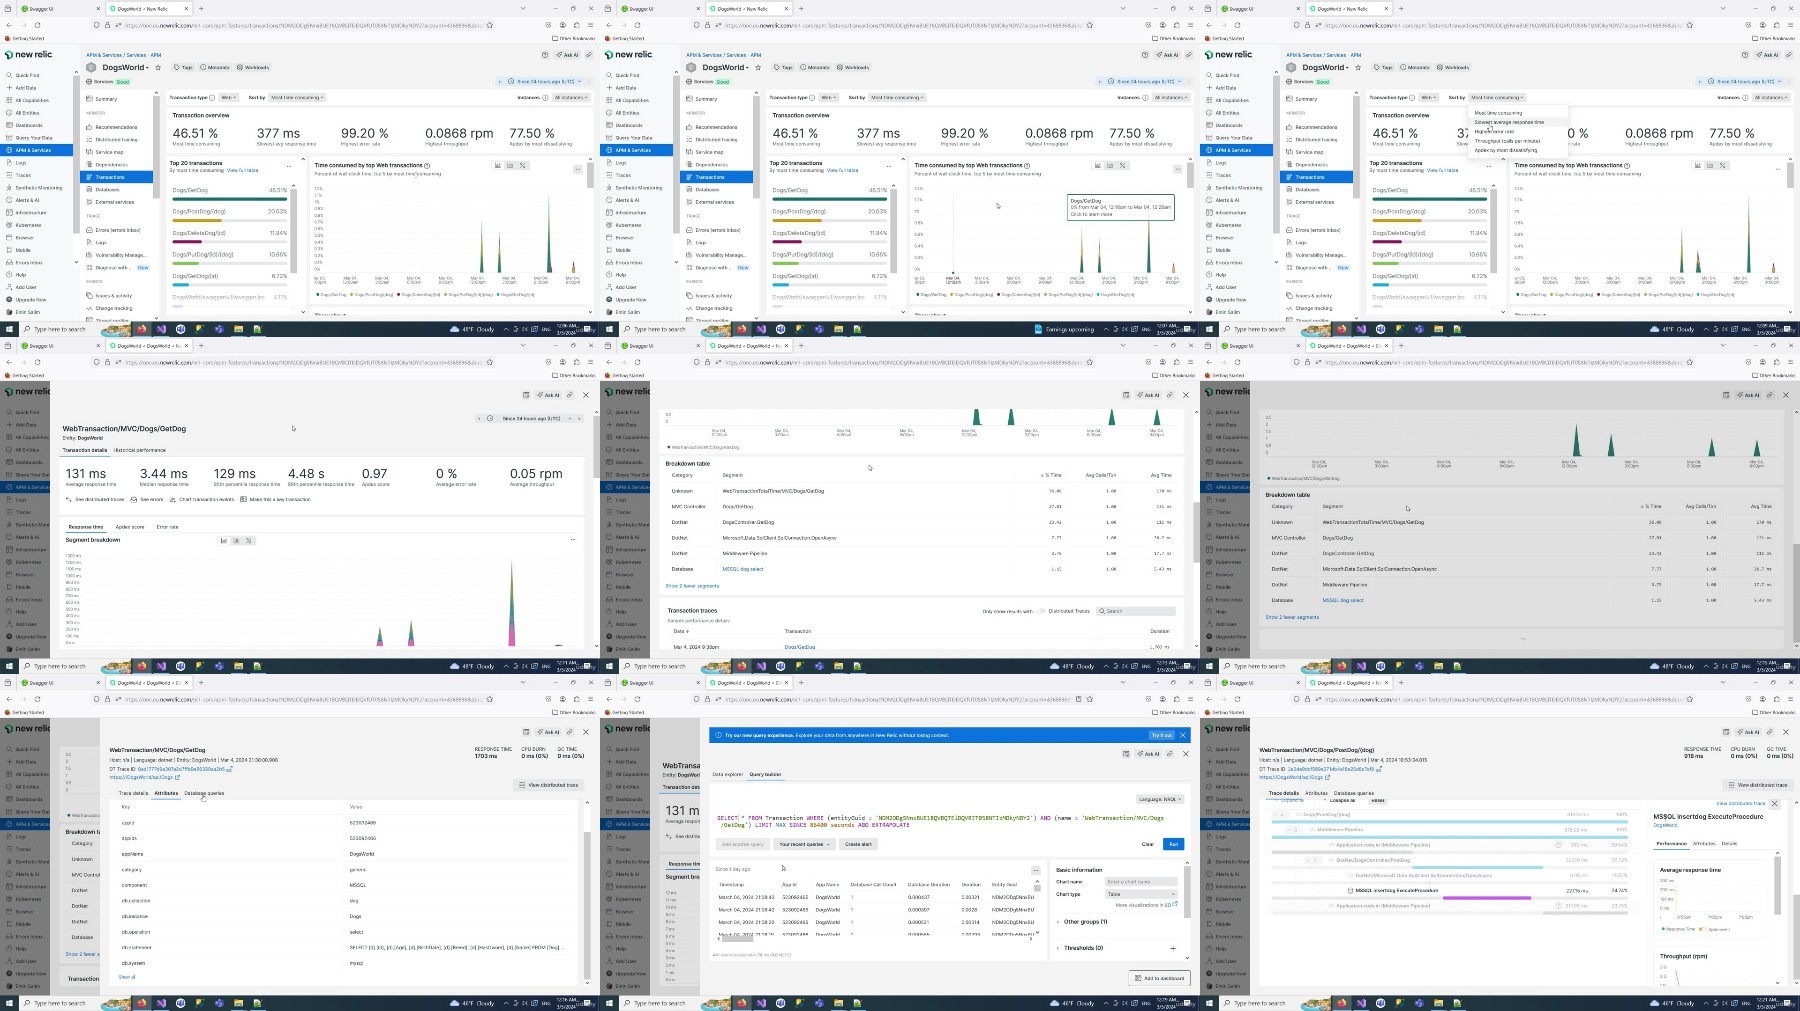
New Relic APM Service monitoring, Transactions, Traces observations and Error Tracking. This includes .NET Core API monitoring with the SQL service layer
APM Services - Database monitoring, Distributed Tracing and Triage Errors
Alerts/Monitors creation for host and services. Monitors for latency, error and success call rates and sql query duration
Synthetic Monitoring: Performing API and Availability Alert with Notification. Using GET/Post methods with request body
Dashboards creation with different widgets. Pre-build dashboards and variable usages
Understand SLA, SLO, SLI and Error Budget by creating New Relic SLO for success rate (DevOps)
Monitor application key aspects like availability, reliability, scalability and duration. Also monitor top slowest queries.
Administration: User Preferences, Plan Usage, Data Usage and Access Management
Requirements
Almost no programming experience needed
Description
Understanding APM and New Relic:
Basic and advanced concepts of APM and New Relic tool usage.
Four Golden Signals of Monitoring
Building APM with New Relic:
Step-by-step guide to building APM for your application from scratch.
APM Service Monitoring:
Monitoring Transactions, Traces, and Errors, including .NET Core API and SQL service layer.
APM Services:
Database monitoring, distributed tracing, and triaging errors.
Creating Alerts:
Setting up alerts for request latency, error rate, specific API endpoints, SQL query duration, and host data reporting.
We will undestand basic Definitions, Policies, Conditions, Workflows, Destinations, Incidents and Issues.
Creating Postmortem after issue close
Synthetic Monitoring:
Performing API and availability alerting with notification using GET/Post methods.
Creating Dashboards:
Designing dashboards with widgets for response time, error rate, AppDex, host graph usage, service map usage, and applying formulas.
Pre-build dashboards and variable usages
New Relic Agent Installations and Configurations:
Installing agents, configuring settings, and querying basic metrics.
Understanding SLA, SLO, SLI, and Error Budget:
Creating New Relic SLO/SLI for success rate (DevOps).
SLA Reports
Integration with Emails and Slack:
Integrating monitors with emails and Slack for streamlined communication.
Monitoring Application Aspects:
Tracking availability, reliability, scalability, and duration.
Visualizing Request Paths:
Visualizing the entire request path to identify bottlenecks and errors quickly.
Administration:
Managing user preferences, plan usage, data usage, and access management
Understading New Relic Query Language (NRQL) with APM Key Metrics
Who this course is for:
For Developers and Managers which wants to improve their application performance and security.
More Info

Free search engine download: New Relic Performance monitoring tool (from Zero to Hero)
