Storytelling With Geospatial Data

Storytelling With Geospatial Data
Published 7/2024
MP4 | Video: h264, 1920x1080 | Audio: AAC, 44.1 KHz
Language: English | Size: 809.21 MB | Duration: 0h 50m
quantitative insights from economics, ecology, geopolitics, infrastructure, and sustainability
What you'll learn
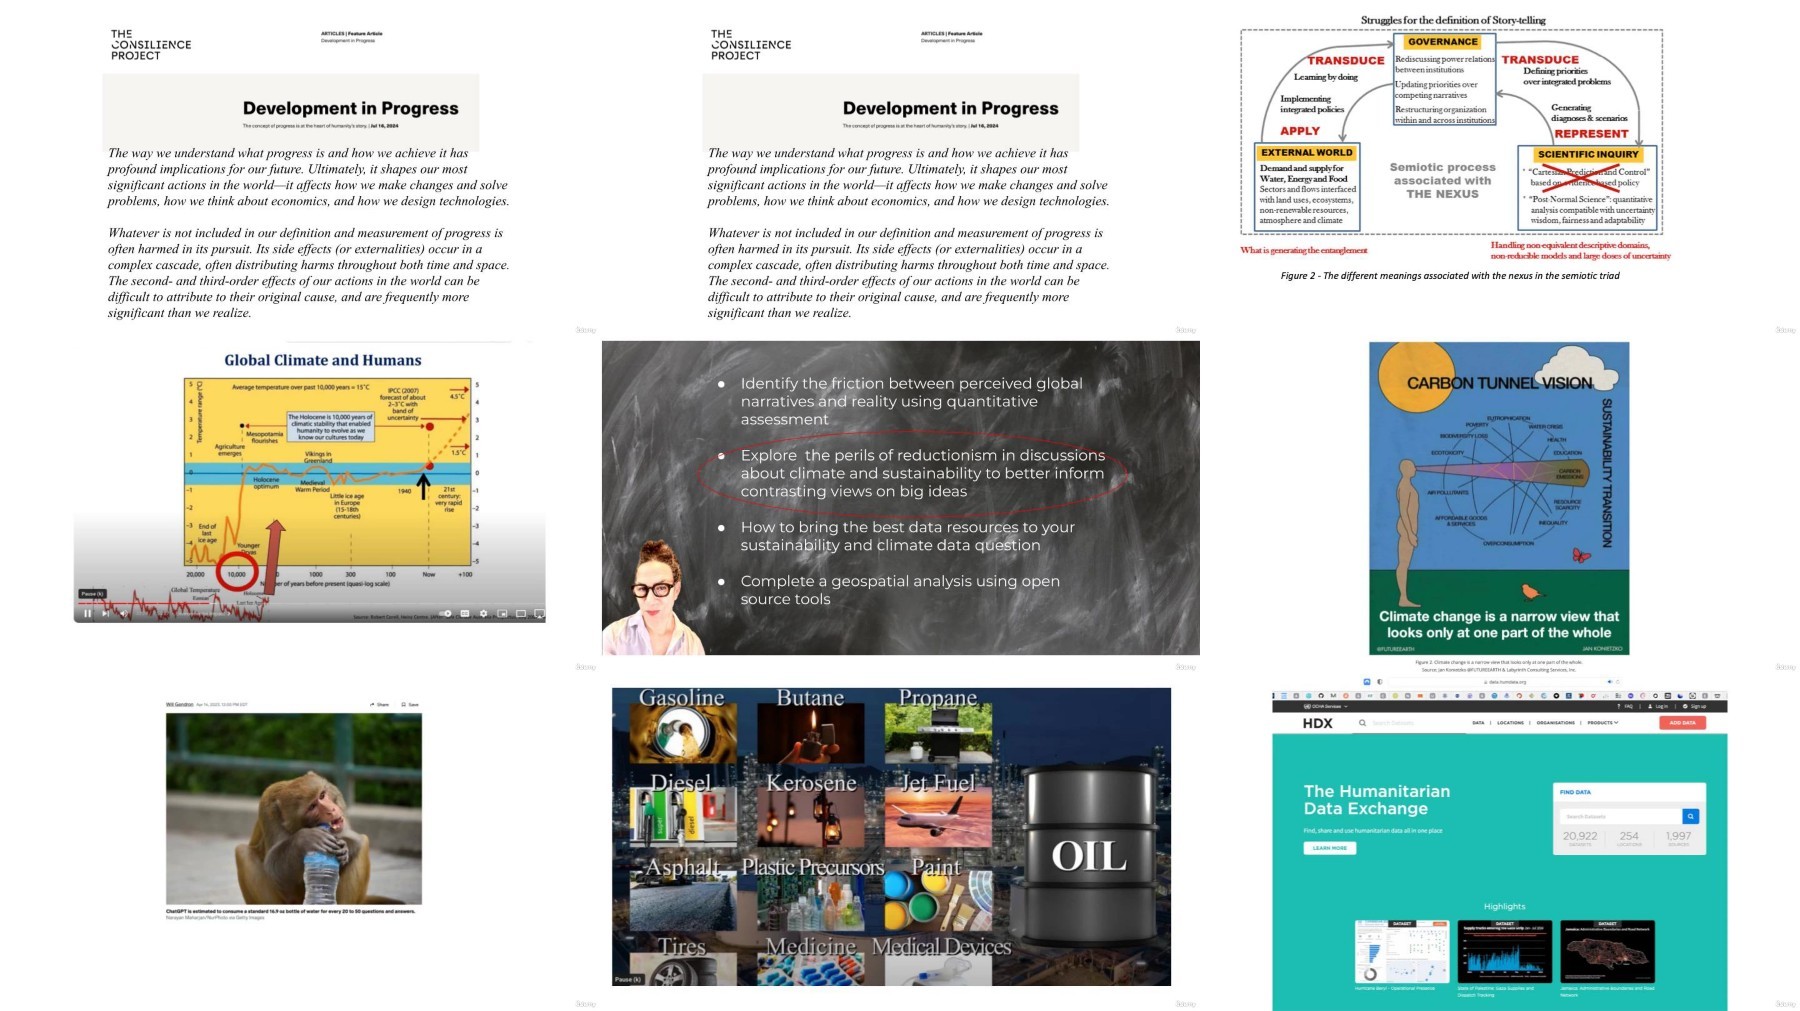
Identify the friction between perceived global narratives and reality using quantitative assessment
Explore the perils of reductionism in discussions about climate and sustainability to better inform contrasting views on big ideas
How to bring the best data resources to your sustainability and climate data question
Complete a geospatial analysis using open source tools
Requirements
Bring your curiosity and everything else will be provided. Experience with QGIS or other GIS tools will be helpful but not necessary.
Description
Storytelling is more than simply words spilling out onto a page or into our liminal space. Often, people think they are sharing a story when actually it is simply a topic. We need a plot, a journey or arc, and typically somebody or something is changed or reimagined. In this course, you will learn how to master the difference between simply being knowledgable about a topic and skills for conveying a meaningful story. Quantitative storytelling addresses a variety of worldviews and perspectives. Think about the different narratives around sustainability and climate science. It is tempting to tease them apart and forget about the uncertainty in the role each aspect plays. Creating narrative and ideas around physical-cultural-ecological facilities required for sustainable operation of infrastructure at interface between production and consumption. Geospatial analysts and scientists evaluate demographic shifts, social and cultural shifts, economic shifts, and environmental dynamics–what we need now is a powerful intersection of our insights. Understanding the role of location intelligence and spatial awareness just might be the missing link. Using open source tools and data we will examine how powerful data questions elevate our discussion and re-focus potential solutions to address community level discord and marginalization.Climate change is a good case in point – there is genuine disagreement on the maps of the territory, such that nobody seems sure if the situation is challenging, grim or apocalyptic – and the point is that the range of maps that make the cases for those claims are part of the reality that confounds our capacity to address it.For several decades now, there have been reductions in absolute poverty, improvements in literacy and life expectancy, and significant technological and medical progress. And yet there is also cascading ecological collapse, socially corrosive inequality and widespread governance failures, many of which relate to apparent technological successes. The simultaneous presence of progress on some metrics and collapse on others is a feature of the crisis, not a bug, because it drives concurrent narratives that obscure our sense of what's happening and confounds consensus on how radically we should seek to change our ways.
Overview
Section 1: Introduction
Lecture 1 Introduction
Lecture 2 Lexicon for storytelling
Section 2: Electric vehicles and the green revolution
Lecture 3 Finding the elements of a story
Lecture 4 Introduction to resources and tools
Section 3: Lecture 3: Practice
Lecture 5 Telling stories quantitatively
Are you interested in breathing life and insight into your data stories? This course is for data stewards, scientists and analysts interested in collecting data and exploring deeper narratives aligned with the quality of the analysis, characteristics of the frameworks, and defined assumptions.

