Learn Statistics & Biostatistics Data Analysis From Scratch
Learn Statistics & Biostatistics Data Analysis From Scratch
Published 9/2024
MP4 | Video: h264, 1920x1080 | Audio: AAC, 44.1 KHz
Language: English | Size: 5.39 GB | Duration: 10h 22m
Learn fundamentals of statistics and biostatistics from very basic to upward with R-Programming (Coding Exercise)
What you'll learn
Basics Concepts Related to Data and Its Types
Different Types of Sampling Stratagies and Their Applications to Collect Data
Installation of R and R-Studio in Operating System
Core Functionalities of R and R-Studio & Fundamentals of R-Programming
Installation of R-Packages and Use of Their Functions in Coding
Core Concepts of Discriptive Statistics and Visulization of Data
Use of R ProgrammingTo Calculation Discriptive Statistics and Data Visulization
Concept of Probability, Types and Their Application in Daily Life
Use of R Programming to Calculate Probabilities
Concept of Correlation and Its Types
Use of R Programming to Calculate Pearson, Kendalls and Spearman Correlation
Detailed Concept of Regression and Its Types
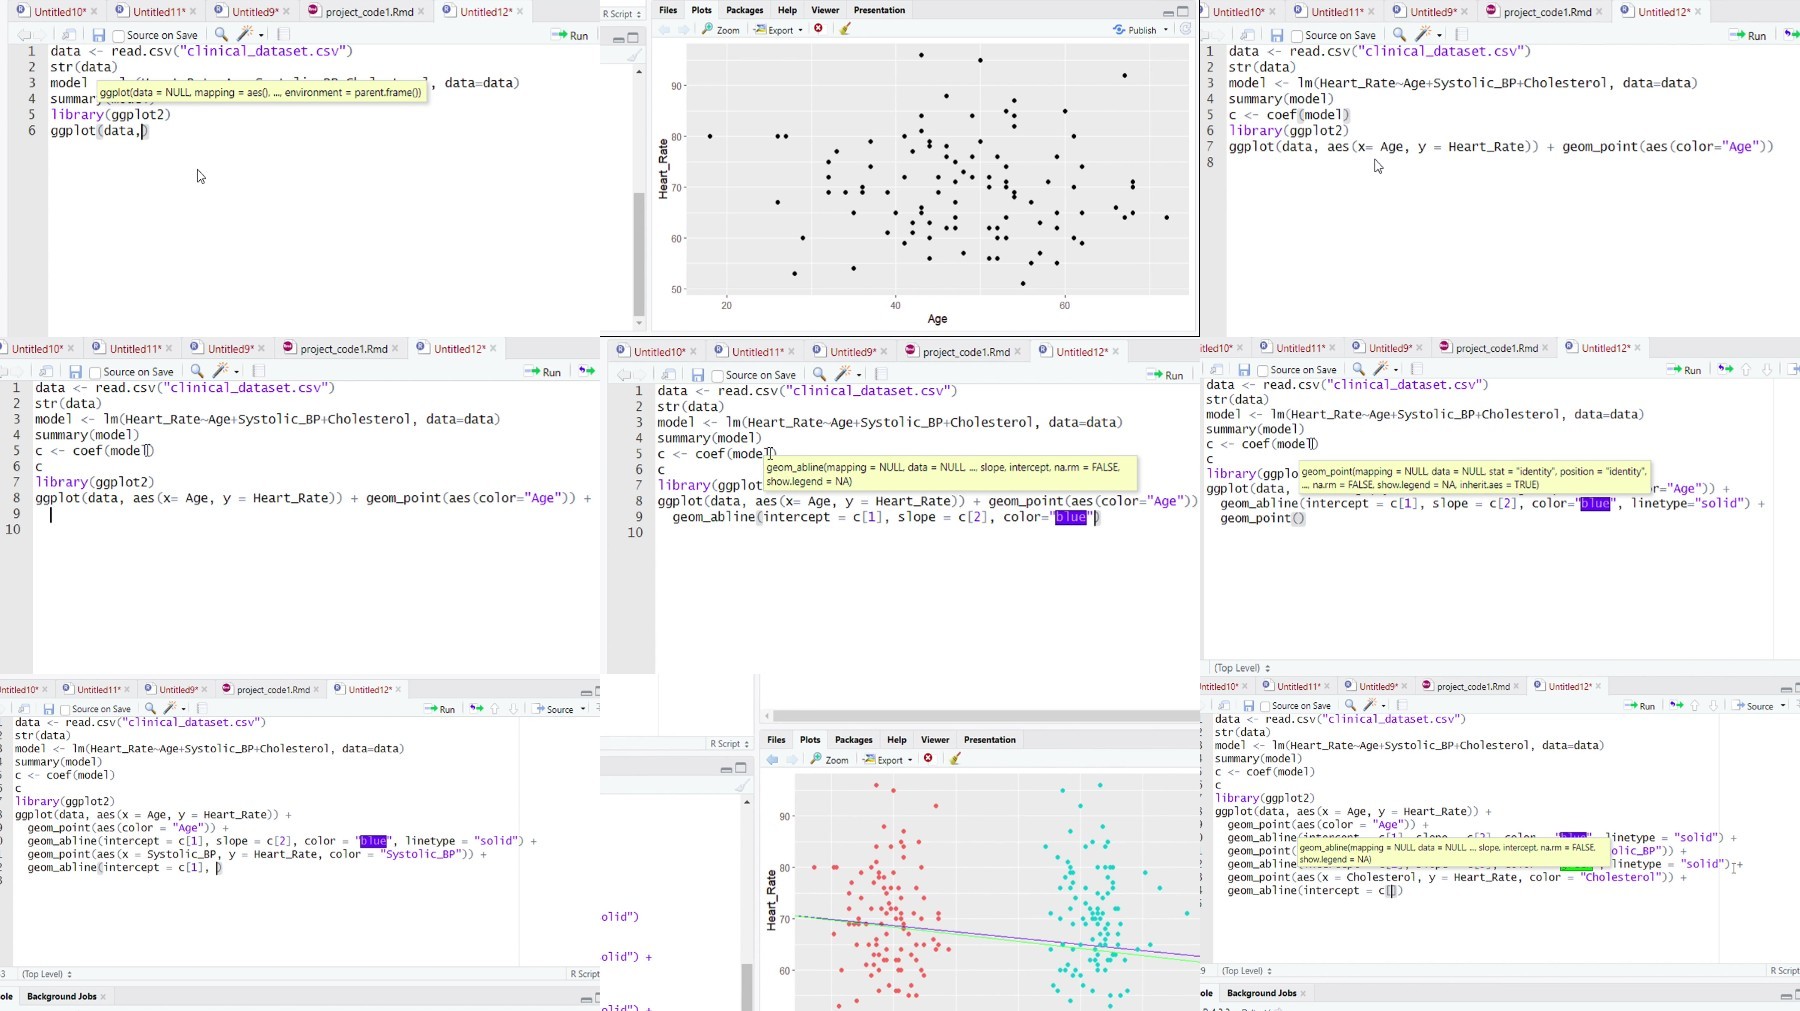
Use of R Programming To Build Linear and Logistic Regression
Detailed Concept of Hypothesis Testing and Different Types of Hypothesis Tests (Z-Test, T-Test, F-Test, ANOVA, Chi-Sq))
Use of R Programming to Calculate Different Test Statistics
Requirements
This course is tailored for beginners, with no prerequisites required. Even if you're new to statistics and R programming, there's no need to worry. We'll start from the very basics and gradually build your understanding step-by-step, ensuring you grasp each concept clearly and can easily follow along with the content.
Description
Welcome to our fourth course "Learn Statistics & Biostatistics Data Analysis From Scratch". In this course, you will start from the very fundamentals of Data and slowly move forward to the analysis of the data using different statistical tools. In an era dominated by big data and machine learning, statistics is the cornerstone that allows us to make sense of the vast amounts of information we collect. It provides the methodologies for the collection, analysis, interpretation, and presentation of data. This course not only makes you literate in the language of data but also empowers you to make informed decisions in business, science, and technology.In this course, you will also learn the R-Programming to calculate different statistics on your data. R programming is one of the most sought-after skills in the fields of statistics, biostatistics and data analysis. With its extensive libraries and frameworks, R provides an unparalleled platform for analyzing and visualizing data, making it an indispensable tool for statisticians and data scientists. This course provides hands-on experience with R, ensuring you can apply statistical methods effectively in real-world scenarios.This course is divided into Eight ModulesWhat is Data? - Understand the basics of data, its types, and how it's collected and organized.Introduction to R Programming - Dive into R and R-studio, a powerful tool for statistical computing and graphics, essential for modern data analysis.Descriptive Statistics - Learn to summarize and describe the essential features of numerical data, crucial for initial data exploration. You will also learn how to build their visualization. Handling Categorical Data - Explore techniques for effectively managing and analyzing categorical variables.Probabilities - Gain insights into the concepts of probability, a foundational pillar for statistical inference. You will understand the subjective, classical, conditional, etc probabilities concepts at the end of this module. Correlation - Discover the methods to measure the strength and direction of a relationship between two variables. We will explain to you the Pearson, Kendall and Spearman correlations.Regression - Understand how to model relationships between variables and make predictions. We will teach you about Simple linear Regression, Multiple Linear Regression, and Logistic Regression. Hypothesis Testing - Develop the ability to test assumptions and make decisions based on data. You will learn the Z-test, T-test and its types, F-test, ANOVA and its types, and Chi-Sq test and its types. This course is a unique blend of theory and practical. You will learn the theory of statistical concepts and along with it you will learn the R-programming to apply those statistical concepts to your data. We hope this journey will be enlightening for you. After having this course, you will be confident to analyze your data by your own.
Overview
Section 1: What is Data?
Lecture 1 Welcome to the Course
Lecture 2 What is Data?
Lecture 3 Different Types Data; Numeric & Categorical Data
Lecture 4 Types of Categorical Data; Ordinal & Simple Categorical
Lecture 5 Factorial Data
Lecture 6 Discretization of Data; Converting Numeric Variable to Categorical One
Lecture 7 How to Get Data? (Observational and Experimental Studies)
Lecture 8 Confounding Variables
Lecture 9 Random Sampling and Random Assignment to Collect Data
Lecture 10 How to Get Sample Data From Population For Observational Studies?
Lecture 11 Random Sampling; Popular Sampling Strategy
Lecture 12 Stratified Sampling Strategy for Data That is Heterogenous Distributed
Lecture 13 Cluster and Multi-Stage Sampling Strategies
Section 2: Hands On on R and R-Studio (Basic Working Principles)
Lecture 14 Installation of R and R-Studio
Lecture 15 Setting Working Directory in R-Studio
Lecture 16 Basic Data Types That R can Handle
Lecture 17 Vector; A Simplest Form Of Data Type in R
Lecture 18 Matrix; A Tabular Form of Data in R
Lecture 19 DataFrame; Most Used Data Type in R
Lecture 20 List; A Big Container to Hold Data
Lecture 21 What is Variable? Rules to Set Variable Names
Lecture 22 R Base Package and Functions; An Important Video
Lecture 23 Functions and Packages in R
Lecture 24 Brief Introduction of Bioconductor For Biological Data
Section 3: Descriptive Statistics
Lecture 25 Basic Definition of Statistics
Lecture 26 Two Basic Types of Statistics
Lecture 27 Distribution of Data; Normal and Skewed
Lecture 28 Different Types of Plots to See Distribution of Data
Lecture 29 Practical-3.1: How to Build Plots in R to See Distribution of Data
Lecture 30 Concept of Central Tendency and Mean
Lecture 31 Concept of Median Value of Data
Lecture 32 Basic Concept of Outliers in Data
Lecture 33 How to Identify the Outliers
Lecture 34 Important Properties of Mean and Median
Lecture 35 Where to Apply Mean and Median; A Clinical Example
Lecture 36 Concept of Mode; Most Frequent Value in Data
Lecture 37 Practical-3.2: Calculate Mean, Median and Mode In R
Lecture 38 Interquartile Range (IQR); Get an Idea about Spread of Data
Lecture 39 Practical-3.3: Calculation of IQR in R
Lecture 40 Variance and Standard Deviation (Part-1)
Lecture 41 Practical-3.4: Calculation of Variance in R
Lecture 42 Variance and Standard Deviation (Part-2)
Lecture 43 Practical-3.5: Calculation of Standard Deviation in R
Lecture 44 Calculate All Descriptive Statistics For Numeric Variables At Once
Section 4: Handling the Categorical Data
Lecture 45 Welcome to Module 4; Handling of Catagorical Data
Lecture 46 R may Not Identify Categorical Variables Properly
Lecture 47 Practical-4.1: How to Rectify R Mistake Regarding Categorical Variables
Lecture 48 Frequency Tables; Basic Statistical Analysis of Categorical Variables
Lecture 49 Practical-4.2: Building Frequency Tables in R
Lecture 50 Percentages & Proportions to Make Sense of Categorical Data
Lecture 51 Practical-4.3: Calculations of Percentages & Proportions in R
Lecture 52 Mode for Categorical Data
Lecture 53 Practical-4.4: Finding Mode of Categorical Data
Lecture 54 Contingency Table To Figure Out Relationship of Two Categorical Variables
Lecture 55 Practical-4.5: Building Contingency Table of Two Categorical Variables
Lecture 56 Different Visualization Method for Categorical Data
Lecture 57 Practical-4.6: Building Visualization of Single Categorical Data
Lecture 58 Practical-4.7: Building Visualization of Two Categorical Data Together
Section 5: Probability
Lecture 59 Introduction of Probability
Lecture 60 Types of Probability and Classical Probability
Lecture 61 Emperical and Subjective Probability
Lecture 62 Conditional Probability
Section 6: Correlation
Lecture 63 Introduction of Correlation; Important Statistical Concept
Lecture 64 Parametric and Non-Parametric Distribution
Lecture 65 Pearson Correlation
Lecture 66 Practical: Pearson Correlation Calculation in R
Lecture 67 ggplot2: Brief Introduction of Data Visulization Package
Lecture 68 ggplot2: Practical Tutoriall To Make Visulization in R-Studio
Lecture 69 Spearman Correlation
Lecture 70 Spearman Correlation Example
Lecture 71 Practical: Spearman Correlation Calculation in R
Lecture 72 Kendall Correlation
Lecture 73 Correlation Summary
Section 7: Regression Analysis
Lecture 74 Regression; Most Decorated Statistical Concept
Lecture 75 Fundamental Defination of Regression
Lecture 76 Different Types of Regression
Lecture 77 Simple Linear Regression; A Simple Elaboration
Lecture 78 Predicted Power of Simple Linear Regression
Lecture 79 Concept of Residual in Regression (Very Important)
Lecture 80 Concept of R-Square Value in Regression Results
Lecture 81 Explantion of R Code to Build Simple Linear Regression
Lecture 82 Practical-7.1: Building Simple Regression Model in R
Lecture 83 Practical-7.2: Understanding of Simple Linear Regression Results in R
Lecture 84 Introduction of Multiple Linear Regression
Lecture 85 Defination of Multiple Linear Regression
Lecture 86 Practical-7.3: How to Build Multiple Regression Model in R
Lecture 87 Practical-7.4: How to Visulize Multiple Regression Model in R Using ggplot
Lecture 88 Practical-7.5: Understanding of Multiple Regression Model Results in R
Lecture 89 Basic Assumption that Holds True in Good Multiple Regression Model
Lecture 90 Concept of Linearity
Lecture 91 Concept of Independence
Lecture 92 Introduction to Logistic Regression (Part-1)
Lecture 93 Introduction to Logistic Regression (Part-2)
Lecture 94 Explantion of Statistical Formula of Logistic Regression
Lecture 95 Logistic Regression R-Code; An Introduction
Lecture 96 Practical 7.6: Building Logistic Regression Model in R-Studio
Lecture 97 Interpretation of Logistic Model Results From R-Studio
Lecture 98 Calculation of Probabilities From Logistic Regression Model
Lecture 99 Interpretation of Logistic Regression Curve
Section 8: Hypothesis Testing
Lecture 100 Introduction of Module
Lecture 101 What is hypothesis, Its types and Type-I & Type-II Error
Lecture 102 Couple of Examples of Hypothesis Formulation
Lecture 103 Basic Workflow of Hypothesis Testing
Lecture 104 What is Level of Significance?
Lecture 105 Different type of Test for Hypothesis Testing
Lecture 106 Traditional Method to Make Decsion About Hypothesis
Lecture 107 P-value based Method to Take decsion
Lecture 108 Very Important Note Before Talking About Tests
Lecture 109 Introduction to Z-test and Its Types
Lecture 110 Example of Z-test to Test Hypothesis
Lecture 111 What if we have Negative Test Value?
Lecture 112 Practical-8.1: Performing One Sample Z-test in R
Lecture 113 Introduction ot T-Test
Lecture 114 One Sample T-Test and Its Example
Lecture 115 Practical-8.2: Performing One Sample T-test in R
Lecture 116 Two Sample Independent T-Test
Lecture 117 Explanation of R Code to Perform Two Sample Independent T-Test
Lecture 118 Practical-8.3: Performing Two Sample Indepedent T-test in R
Lecture 119 Two Sample Dependent (Paired) T-test
Lecture 120 Explanation of R Code to Perform Two Sample Dependent (Paired) T-Test
Lecture 121 Practical-8.4: Performing Two Sample Dependent (Paired) T-Test in R
Lecture 122 Practical-8.5: How Type-I and Type-II Error can Occur?
Lecture 123 F-Test
Lecture 124 Comparsion of F-Test with T and Z-Test
Lecture 125 Explantion of R Code to perform F-Test
Lecture 126 Practical-8.6: Performing F-Test in R
Lecture 127 Introduction of ANOVA and Its Types
Lecture 128 What is One Way ANOVA & How to Calculate it?
Lecture 129 Explanation of R Code to Perform One Way ANOVA
Lecture 130 Practical-8.7: Performing One Way ANOVA in R
Lecture 131 What is Two Way ANOVA & How to Calculate it?
Lecture 132 Explanation of R Code for Two Way ANOVA
Lecture 133 Practical-8.8: Performing Two Way ANOVA in R
Lecture 134 Introduction of Chi-Sq Test; A Non-parametric Test
Lecture 135 Chi-Sq Test of Independence Theory
Lecture 136 Explanation of R Code of Chi-Sq Test of Independence
Lecture 137 Practical:8.9: Chi-Sq Test of Independence in R
Lecture 138 Chi-Sq Goodness of Fit Test
Lecture 139 Explanation of R Code of Chi-Sq Goodness of Fit
This course is for broad audiance.,Students from basic sciences, particularly those in life sciences, will find this course especially beneficial, as it is designed to cater to their needs and enhance their understanding of R programming in scientific contexts.,Computer science students aiming for a career in data science will greatly benefit from this course, as it provides foundational skills in R programming that are essential for data analysis and interpretation in the field.,Sociologists who collect population data and wish to analyze and visualize it independently will find this course highly beneficial, as it equips them with the skills to effectively manage, analyze, and present data using R programming.,Not highly recommended but economics and finance students who analyze market trends and financial data will benefit from this course, as it provides the tools to independently conduct statistical analysis and create impactful data visualizations.
https://ddownload.com/fxz8sorj38pz/Udemy_Learn_Statistics_Biostatistics_Data_Analysis_From_Scratch.part1.rar
https://ddownload.com/olmsa17xjz83/Udemy_Learn_Statistics_Biostatistics_Data_Analysis_From_Scratch.part2.rar
https://ddownload.com/csj4j5o10ps6/Udemy_Learn_Statistics_Biostatistics_Data_Analysis_From_Scratch.part3.rar
https://rapidgator.net/file/0dac5d5b4ce526e7d6d1c16206333ad3/Udemy_Learn_Statistics_Biostatistics_Data_Analysis_From_Scratch.part1.rar
https://rapidgator.net/file/eff3182c685e1b992d3738fa9c4e2780/Udemy_Learn_Statistics_Biostatistics_Data_Analysis_From_Scratch.part2.rar
https://rapidgator.net/file/58a9a4277e18b70bf849ffdd4b4fcd38/Udemy_Learn_Statistics_Biostatistics_Data_Analysis_From_Scratch.part3.rar
https://turbobit.net/olo32i5bwdom/Udemy_Learn_Statistics_Biostatistics_Data_Analysis_From_Scratch.part1.rar.html
https://turbobit.net/all5o9bxtcbl/Udemy_Learn_Statistics_Biostatistics_Data_Analysis_From_Scratch.part2.rar.html
https://turbobit.net/8fdyxdayhzuj/Udemy_Learn_Statistics_Biostatistics_Data_Analysis_From_Scratch.part3.rar.html
What you'll learn
Basics Concepts Related to Data and Its Types
Different Types of Sampling Stratagies and Their Applications to Collect Data
Installation of R and R-Studio in Operating System
Core Functionalities of R and R-Studio & Fundamentals of R-Programming
Installation of R-Packages and Use of Their Functions in Coding
Core Concepts of Discriptive Statistics and Visulization of Data
Use of R ProgrammingTo Calculation Discriptive Statistics and Data Visulization
Concept of Probability, Types and Their Application in Daily Life
Use of R Programming to Calculate Probabilities
Concept of Correlation and Its Types
Use of R Programming to Calculate Pearson, Kendalls and Spearman Correlation
Detailed Concept of Regression and Its Types
Use of R Programming To Build Linear and Logistic Regression
Detailed Concept of Hypothesis Testing and Different Types of Hypothesis Tests (Z-Test, T-Test, F-Test, ANOVA, Chi-Sq))
Use of R Programming to Calculate Different Test Statistics
Requirements
This course is tailored for beginners, with no prerequisites required. Even if you're new to statistics and R programming, there's no need to worry. We'll start from the very basics and gradually build your understanding step-by-step, ensuring you grasp each concept clearly and can easily follow along with the content.
Description
Welcome to our fourth course "Learn Statistics & Biostatistics Data Analysis From Scratch". In this course, you will start from the very fundamentals of Data and slowly move forward to the analysis of the data using different statistical tools. In an era dominated by big data and machine learning, statistics is the cornerstone that allows us to make sense of the vast amounts of information we collect. It provides the methodologies for the collection, analysis, interpretation, and presentation of data. This course not only makes you literate in the language of data but also empowers you to make informed decisions in business, science, and technology.In this course, you will also learn the R-Programming to calculate different statistics on your data. R programming is one of the most sought-after skills in the fields of statistics, biostatistics and data analysis. With its extensive libraries and frameworks, R provides an unparalleled platform for analyzing and visualizing data, making it an indispensable tool for statisticians and data scientists. This course provides hands-on experience with R, ensuring you can apply statistical methods effectively in real-world scenarios.This course is divided into Eight ModulesWhat is Data? - Understand the basics of data, its types, and how it's collected and organized.Introduction to R Programming - Dive into R and R-studio, a powerful tool for statistical computing and graphics, essential for modern data analysis.Descriptive Statistics - Learn to summarize and describe the essential features of numerical data, crucial for initial data exploration. You will also learn how to build their visualization. Handling Categorical Data - Explore techniques for effectively managing and analyzing categorical variables.Probabilities - Gain insights into the concepts of probability, a foundational pillar for statistical inference. You will understand the subjective, classical, conditional, etc probabilities concepts at the end of this module. Correlation - Discover the methods to measure the strength and direction of a relationship between two variables. We will explain to you the Pearson, Kendall and Spearman correlations.Regression - Understand how to model relationships between variables and make predictions. We will teach you about Simple linear Regression, Multiple Linear Regression, and Logistic Regression. Hypothesis Testing - Develop the ability to test assumptions and make decisions based on data. You will learn the Z-test, T-test and its types, F-test, ANOVA and its types, and Chi-Sq test and its types. This course is a unique blend of theory and practical. You will learn the theory of statistical concepts and along with it you will learn the R-programming to apply those statistical concepts to your data. We hope this journey will be enlightening for you. After having this course, you will be confident to analyze your data by your own.
Overview
Section 1: What is Data?
Lecture 1 Welcome to the Course
Lecture 2 What is Data?
Lecture 3 Different Types Data; Numeric & Categorical Data
Lecture 4 Types of Categorical Data; Ordinal & Simple Categorical
Lecture 5 Factorial Data
Lecture 6 Discretization of Data; Converting Numeric Variable to Categorical One
Lecture 7 How to Get Data? (Observational and Experimental Studies)
Lecture 8 Confounding Variables
Lecture 9 Random Sampling and Random Assignment to Collect Data
Lecture 10 How to Get Sample Data From Population For Observational Studies?
Lecture 11 Random Sampling; Popular Sampling Strategy
Lecture 12 Stratified Sampling Strategy for Data That is Heterogenous Distributed
Lecture 13 Cluster and Multi-Stage Sampling Strategies
Section 2: Hands On on R and R-Studio (Basic Working Principles)
Lecture 14 Installation of R and R-Studio
Lecture 15 Setting Working Directory in R-Studio
Lecture 16 Basic Data Types That R can Handle
Lecture 17 Vector; A Simplest Form Of Data Type in R
Lecture 18 Matrix; A Tabular Form of Data in R
Lecture 19 DataFrame; Most Used Data Type in R
Lecture 20 List; A Big Container to Hold Data
Lecture 21 What is Variable? Rules to Set Variable Names
Lecture 22 R Base Package and Functions; An Important Video
Lecture 23 Functions and Packages in R
Lecture 24 Brief Introduction of Bioconductor For Biological Data
Section 3: Descriptive Statistics
Lecture 25 Basic Definition of Statistics
Lecture 26 Two Basic Types of Statistics
Lecture 27 Distribution of Data; Normal and Skewed
Lecture 28 Different Types of Plots to See Distribution of Data
Lecture 29 Practical-3.1: How to Build Plots in R to See Distribution of Data
Lecture 30 Concept of Central Tendency and Mean
Lecture 31 Concept of Median Value of Data
Lecture 32 Basic Concept of Outliers in Data
Lecture 33 How to Identify the Outliers
Lecture 34 Important Properties of Mean and Median
Lecture 35 Where to Apply Mean and Median; A Clinical Example
Lecture 36 Concept of Mode; Most Frequent Value in Data
Lecture 37 Practical-3.2: Calculate Mean, Median and Mode In R
Lecture 38 Interquartile Range (IQR); Get an Idea about Spread of Data
Lecture 39 Practical-3.3: Calculation of IQR in R
Lecture 40 Variance and Standard Deviation (Part-1)
Lecture 41 Practical-3.4: Calculation of Variance in R
Lecture 42 Variance and Standard Deviation (Part-2)
Lecture 43 Practical-3.5: Calculation of Standard Deviation in R
Lecture 44 Calculate All Descriptive Statistics For Numeric Variables At Once
Section 4: Handling the Categorical Data
Lecture 45 Welcome to Module 4; Handling of Catagorical Data
Lecture 46 R may Not Identify Categorical Variables Properly
Lecture 47 Practical-4.1: How to Rectify R Mistake Regarding Categorical Variables
Lecture 48 Frequency Tables; Basic Statistical Analysis of Categorical Variables
Lecture 49 Practical-4.2: Building Frequency Tables in R
Lecture 50 Percentages & Proportions to Make Sense of Categorical Data
Lecture 51 Practical-4.3: Calculations of Percentages & Proportions in R
Lecture 52 Mode for Categorical Data
Lecture 53 Practical-4.4: Finding Mode of Categorical Data
Lecture 54 Contingency Table To Figure Out Relationship of Two Categorical Variables
Lecture 55 Practical-4.5: Building Contingency Table of Two Categorical Variables
Lecture 56 Different Visualization Method for Categorical Data
Lecture 57 Practical-4.6: Building Visualization of Single Categorical Data
Lecture 58 Practical-4.7: Building Visualization of Two Categorical Data Together
Section 5: Probability
Lecture 59 Introduction of Probability
Lecture 60 Types of Probability and Classical Probability
Lecture 61 Emperical and Subjective Probability
Lecture 62 Conditional Probability
Section 6: Correlation
Lecture 63 Introduction of Correlation; Important Statistical Concept
Lecture 64 Parametric and Non-Parametric Distribution
Lecture 65 Pearson Correlation
Lecture 66 Practical: Pearson Correlation Calculation in R
Lecture 67 ggplot2: Brief Introduction of Data Visulization Package
Lecture 68 ggplot2: Practical Tutoriall To Make Visulization in R-Studio
Lecture 69 Spearman Correlation
Lecture 70 Spearman Correlation Example
Lecture 71 Practical: Spearman Correlation Calculation in R
Lecture 72 Kendall Correlation
Lecture 73 Correlation Summary
Section 7: Regression Analysis
Lecture 74 Regression; Most Decorated Statistical Concept
Lecture 75 Fundamental Defination of Regression
Lecture 76 Different Types of Regression
Lecture 77 Simple Linear Regression; A Simple Elaboration
Lecture 78 Predicted Power of Simple Linear Regression
Lecture 79 Concept of Residual in Regression (Very Important)
Lecture 80 Concept of R-Square Value in Regression Results
Lecture 81 Explantion of R Code to Build Simple Linear Regression
Lecture 82 Practical-7.1: Building Simple Regression Model in R
Lecture 83 Practical-7.2: Understanding of Simple Linear Regression Results in R
Lecture 84 Introduction of Multiple Linear Regression
Lecture 85 Defination of Multiple Linear Regression
Lecture 86 Practical-7.3: How to Build Multiple Regression Model in R
Lecture 87 Practical-7.4: How to Visulize Multiple Regression Model in R Using ggplot
Lecture 88 Practical-7.5: Understanding of Multiple Regression Model Results in R
Lecture 89 Basic Assumption that Holds True in Good Multiple Regression Model
Lecture 90 Concept of Linearity
Lecture 91 Concept of Independence
Lecture 92 Introduction to Logistic Regression (Part-1)
Lecture 93 Introduction to Logistic Regression (Part-2)
Lecture 94 Explantion of Statistical Formula of Logistic Regression
Lecture 95 Logistic Regression R-Code; An Introduction
Lecture 96 Practical 7.6: Building Logistic Regression Model in R-Studio
Lecture 97 Interpretation of Logistic Model Results From R-Studio
Lecture 98 Calculation of Probabilities From Logistic Regression Model
Lecture 99 Interpretation of Logistic Regression Curve
Section 8: Hypothesis Testing
Lecture 100 Introduction of Module
Lecture 101 What is hypothesis, Its types and Type-I & Type-II Error
Lecture 102 Couple of Examples of Hypothesis Formulation
Lecture 103 Basic Workflow of Hypothesis Testing
Lecture 104 What is Level of Significance?
Lecture 105 Different type of Test for Hypothesis Testing
Lecture 106 Traditional Method to Make Decsion About Hypothesis
Lecture 107 P-value based Method to Take decsion
Lecture 108 Very Important Note Before Talking About Tests
Lecture 109 Introduction to Z-test and Its Types
Lecture 110 Example of Z-test to Test Hypothesis
Lecture 111 What if we have Negative Test Value?
Lecture 112 Practical-8.1: Performing One Sample Z-test in R
Lecture 113 Introduction ot T-Test
Lecture 114 One Sample T-Test and Its Example
Lecture 115 Practical-8.2: Performing One Sample T-test in R
Lecture 116 Two Sample Independent T-Test
Lecture 117 Explanation of R Code to Perform Two Sample Independent T-Test
Lecture 118 Practical-8.3: Performing Two Sample Indepedent T-test in R
Lecture 119 Two Sample Dependent (Paired) T-test
Lecture 120 Explanation of R Code to Perform Two Sample Dependent (Paired) T-Test
Lecture 121 Practical-8.4: Performing Two Sample Dependent (Paired) T-Test in R
Lecture 122 Practical-8.5: How Type-I and Type-II Error can Occur?
Lecture 123 F-Test
Lecture 124 Comparsion of F-Test with T and Z-Test
Lecture 125 Explantion of R Code to perform F-Test
Lecture 126 Practical-8.6: Performing F-Test in R
Lecture 127 Introduction of ANOVA and Its Types
Lecture 128 What is One Way ANOVA & How to Calculate it?
Lecture 129 Explanation of R Code to Perform One Way ANOVA
Lecture 130 Practical-8.7: Performing One Way ANOVA in R
Lecture 131 What is Two Way ANOVA & How to Calculate it?
Lecture 132 Explanation of R Code for Two Way ANOVA
Lecture 133 Practical-8.8: Performing Two Way ANOVA in R
Lecture 134 Introduction of Chi-Sq Test; A Non-parametric Test
Lecture 135 Chi-Sq Test of Independence Theory
Lecture 136 Explanation of R Code of Chi-Sq Test of Independence
Lecture 137 Practical:8.9: Chi-Sq Test of Independence in R
Lecture 138 Chi-Sq Goodness of Fit Test
Lecture 139 Explanation of R Code of Chi-Sq Goodness of Fit
This course is for broad audiance.,Students from basic sciences, particularly those in life sciences, will find this course especially beneficial, as it is designed to cater to their needs and enhance their understanding of R programming in scientific contexts.,Computer science students aiming for a career in data science will greatly benefit from this course, as it provides foundational skills in R programming that are essential for data analysis and interpretation in the field.,Sociologists who collect population data and wish to analyze and visualize it independently will find this course highly beneficial, as it equips them with the skills to effectively manage, analyze, and present data using R programming.,Not highly recommended but economics and finance students who analyze market trends and financial data will benefit from this course, as it provides the tools to independently conduct statistical analysis and create impactful data visualizations.
https://ddownload.com/fxz8sorj38pz/Udemy_Learn_Statistics_Biostatistics_Data_Analysis_From_Scratch.part1.rar
https://ddownload.com/olmsa17xjz83/Udemy_Learn_Statistics_Biostatistics_Data_Analysis_From_Scratch.part2.rar
https://ddownload.com/csj4j5o10ps6/Udemy_Learn_Statistics_Biostatistics_Data_Analysis_From_Scratch.part3.rar
https://rapidgator.net/file/0dac5d5b4ce526e7d6d1c16206333ad3/Udemy_Learn_Statistics_Biostatistics_Data_Analysis_From_Scratch.part1.rar
https://rapidgator.net/file/eff3182c685e1b992d3738fa9c4e2780/Udemy_Learn_Statistics_Biostatistics_Data_Analysis_From_Scratch.part2.rar
https://rapidgator.net/file/58a9a4277e18b70bf849ffdd4b4fcd38/Udemy_Learn_Statistics_Biostatistics_Data_Analysis_From_Scratch.part3.rar
https://turbobit.net/olo32i5bwdom/Udemy_Learn_Statistics_Biostatistics_Data_Analysis_From_Scratch.part1.rar.html
https://turbobit.net/all5o9bxtcbl/Udemy_Learn_Statistics_Biostatistics_Data_Analysis_From_Scratch.part2.rar.html
https://turbobit.net/8fdyxdayhzuj/Udemy_Learn_Statistics_Biostatistics_Data_Analysis_From_Scratch.part3.rar.html